Coal-26: World must close nearly 3,000 coal units by 2030 to hit 1.5 degree target
As world leaders gather in Glasgow for COP26 amidst an energy crisis and in the shadow of the pandemic, coal is likely to be the elephant in the room more so than any other climate summit. In this post, we explore what needs to be done to reduce coal electricity in a manner consistent with the 1.5 degree target and why governments now have strong incentives to do so.
3,000 by 2030
To meet the 1.5 degree temperature goal, the world will need to close nearly 3,000 coal units, or around one unit per day, from now until 2030.
The math behind this statement is straightforward. According to Global Energy Monitor (GEM), there is currently over 2,067,713 megawatts (MW) of unabated (i.e. CCS unequipped) coal capacity in operation. As detailed in the IEA’s net-zero emissions scenario, unabated coal capacity declines to 1,192,000 MW by 2030. Operating coal units are currently on average 314 MW in size based on GEM data. This equates to 2,925 coal units, or nearly one unit every day, until 2030, which will need to be retired, retrofitted or converted to meet the 1.5 degree climate target.
For perspective, from 2010 to 2020, 319,549 MW in total was retired with an average unit age of 38 years. While there was a record number of retirements in 2020, there needs to be more than a threefold increase in the amount of capacity closed from 2010 to 2020 to meet a 1.5 degree target. The average age of the world’s existing fleet is currently 22 years, meaning stranded assets from premature closures are all but inevitable.
Retiring this amount of capacity in less than a decade would arguably be impossible if it wasn’t for one nation: China. Half of the world’s coal plants are in China and the nation has already shown an ability to act decisively and comprehensively to decarbonise its electricity grid. China is already a world leader in the production, deployment, and financing of clean energy. Last year, China connected 72 gigawatts (GW) of wind and 48 GW of solar to the grid, an increase that equates to more than three large wind turbines and five football fields of solar panels every hour.
Amidst the rumours that President Xi Jinping will not attend COP26, China has quietly implemented a policy with globally significant climate implications. On 15 October 2021, the National Development and Reform Commission (NDRC) released Notice No. 1439, which requires all of China’s coal plants to sell their electricity in wholesale markets. In short, China is using the energy crisis to accelerate its deregulation agenda, which means their fleet of coal power plants will be subject to market forces.
While policymakers will use any fuel at their disposal to keep the lights on this winter, we believe this policy will prove to be the final nail in the coffin for new coal plant investments in China - and potentially make it possible for the world to align coal electricity with the 1.5 degree target.
The economic incentive to replace and retire coal plants has never been greater
Thermal coal has long been considered cheap and plentiful with no supply chain issues. In 2021, coal is none of those things. Global natural gas and thermal coal prices are currently increasing precipitously as European and Asian buyers fight over the marginal cargo. These moves are pushing electricity prices to record levels and compromising security of supply in China, as coal plant owners refuse to operate to stem losses from inflexible tariff regulations.
While commodity prices will continue to go up and down with investment cycles and geopolitics, supply chain disruptions and dated market regulations have highlighted the energy insecurity issues associated with coal. There are several reasons why this volatility could continue into 2022. Investment cycles will continue to shorten as producers remain under pressure from investors and policymakers to avoid stranded assets from overinvestment. Moreover, trade policy is increasingly being used for non-trade objectives. China's ban of Australian coal and the EU's carbon border adjustment mechanism are recent examples.
Prior to the energy crisis, coal was already becoming uncompetitive, due to deflationary trends in renewable energy. Based on TransitionZero analysis, new investments in wind and solar are cheaper than new coal in all major regions in 2021.
Moreover, the cost profile of coal electricity has deteriorated to the extent that it is cheaper to build new renewable energy capacity than continue to operate coal plants. After accounting for the intermittent and variable nature of wind and solar, in 2020, 22% of operating coal capacity globally may cost more to operate than building new wind or solar facilities. The energy crisis has exacerbated this dynamic to the extent that 64% of coal capacity could cost more to operate than new renewables in 2021.
The growing disparity between the running cost of coal and the total cost of zero-carbon alternatives could lead to significant savings for consumers. For example, based on previous analysis by TransitionZero, replacing China’s coal fleet with zero carbon alternatives could save $1.6 trillion.

Levelised and long-run marginal cost of coal versus value-adjusted levelised cost of onshore wind or solar PV
Given changes to trade policy and investor expectations, as well as continued long-term deflationary trends in zero carbon technologies, world leaders would do well to set clear short-term targets to ensure unabated coal electricity is phased-out by 2030 in advanced economies and globally by 2040. Failure to do so will not only risk missing the 1.5 degree target, but also undermine the competitiveness of their economies in the 21st Century. For these reasons, governments must make COP26 the end of coal.
Notes
The analysis is based on the following countries: China, Czech Republic, Germany, Denmark, Spain, Finland, France, UK, Greece, Hungary, Indonesia, India, Ireland, Italy, Japan, Korea, Netherlands, Philippines, Poland, Portugal, Romania, Slovakia, Slovenia, Sweden and V1. The existing coal versus new renewables cost comparison is based on the difference between the weighted average long-run marginal cost of coal and the value-adjusted levelized cost of electricity (VALCOE) of onshore wind or solar photovoltaics. The exception is India, where we apply the average NTPC thermal tariff data as a proxy for the cost of coal. VALCOE improves upon the commonly utilised LCOE metric by including the integration costs associated with increasing the amount of variable renewable energy on the grid. We use the methodology developed by Hirth (2015), where integration costs equal the load weighted electricity prices minus the market value of variable renewable energy (VRE). For those countries where hourly generation and pricing data is not available, integration costs are proxied using results obtained from markets where the generation mix is comparable. We aim to productionise our data and analytics in early 2022. In the interim, access to this data is available on request.

Coal assumptions
Source: Coal price estimates are based on annual averages, with 2021 being a Q1-Q3 average. Coal prices are compiled from various sources and account for fuel quality, import taxes, transportation costs, etc. Where transport and/or tax information is unavailable, we assume a $5/t transport cost and a 20% import tax. Capital and O&M assumptions are sourced from the IEA. Weighted average cost of capital (WACC) is estimated based on a national level from debt-equity splits, return on equity, commercial loans, and inflation rates. Regarding boiler efficiencies, we implement a scaling methodology of +/- 5% from the baseline efficiency from the IEA. This methodology is based on unit age and boiler technology type within each country.

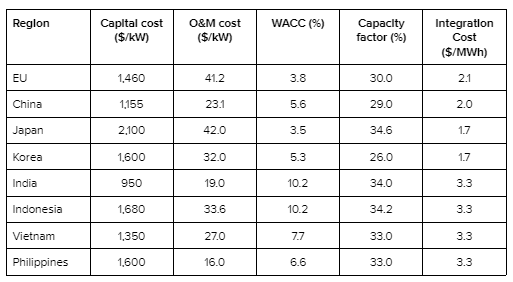
Solar PV assumptions
Source: Capital and O&M cost estimates are from a combination of the IEA (2020) and IRENA (2021). Capacity factors are TransitionZero estimates based on IRENA and PVWatts. Per Hirth (2015), TransitionZero calculates a proxy for integration costs from the difference in hourly baseload prices and the value of the renewable generation during a year. Hourly pricing and revenue data for the EU is obtained from ENTSOE. For those countries where hourly generation and pricing data is not available, integration costs are proxied using results obtained from markets where the generation mix is comparable.
Wind assumptions
Source: Capital and O&M cost estimates are from a combination of IEA (2020) and IRENA (2021). Capacity factors are TransitionZero estimates based on IRENA (2021) and NREL (2021). Per Hirth (2015), TransitionZero calculates a proxy for integration costs from the difference in hourly baseload prices and the value of the renewable generation during a year. Hourly pricing and revenue data for the EU is obtained from ENTSOE. For those countries where hourly generation and pricing data is not available, integration costs are proxied using results obtained from markets where the generation mix is comparable.